Straight line graphs or linear graphs: questions for maths lessons.
Includes questions on drawing graphs, calculating gradients and working out intercepts.
One pdf with questions and a separate pdf with questions and answers.
Questions range from medium to hard.
A PowerPoint is available with correct answers animated so that each question can be discussed as a class or group: /teaching-resource/resource-12946855
Please contact Cubed Maths if you identify any incorrections.
cubed.maths@gmail.com
07949749781
Key words: linear graphs, intersection, gradient, parallel, equation, coordinates, axes, 𝑦=𝑚𝑥+c, 𝑦 axis, 𝑥 axis
One of a series of PowerPoints that use a card sort activity with Wacky Races characters.
The aim here is to position characters according to ordinal clues such as “Penelope Pitstop finished four cars ahead of Peter Perfect”.
High quality with gifs.
Please review if you put the ppt to use.
A spreadsheet to generate the dice outcomes of the seven dice in this popular game. It is useful if dice have gone missing or dice outcomes need to be presented to a group.
There are two views: the faces of the dice and the position of the blockers on the board.
Maths activity: mean, median, mode, range. Two Excel workbooks, one with macros and one without.
11 values of dice throws show the relationships between: ordered values, the frequency table, the averages table and bar chart.
The first workbook has the capability to randomly generate values or manual input. Macros must be enabled to use the second workbook that produces random values.
Based on S4 unit in Improving Learning in Mathematics.
Please contact Cubed Maths if you identify any limitations.
cubed.maths@gmail.com
079 497 497 81
Key words: mean, median, mode, range, statistics, frequency tables, raw scores, ordering, bar charts, dice, random.
Update October 2024. A macro enabled spreadsheet that provides visible representations of multiples and factors.
Use drop-down menus to select integers to show factors and multiples highlighted in 1-100/1-200 number squares.
One square shows the multiples of the first integer. Another shows the multiples of the second integer. The third shows the multiples of both.
The same is shown for factors.
There are 10 sheets:
a) FactorsA - factors of all numbers from 2 up to 200. Show visibly why only integers to half-way are required
b) Factors B - factors of all numbers from 2 up to 200, colour coded showing prime and square numbers
c) F&M - factors & multiples side by side in two 1-200 number grids
d) O&E - even & odd numbers shown in a 1-200 number grid
e) PF - prime factors of three numbers as tiles
f) HCF2 - factors of two integers, showing HCF (three 1-100 grids)
b) HCF3 - factors of three integers, showing HCF (seven 1-100 grids)
c) LCM2a - multiples of two integers, showing LCM (three 1-100 grids)
d) LCM2b - multiples of three integers, showing LCM (seven 1-100 grids)
e) LCM3 - multiples of two integers, showing LCM (one 1-1050 grid)
Macros must be enabled. The sheets are protected so students/teachers can only type in integers in the correct cells. They can be easily unprotected to make changes.
I would welcome any suggestions for improvement.
#Simultaneous equations worksheets: two packs of three sheets.
##Pack 1 - integer answers for x and y##
Sheet 1: twelve questions, no scaling: Q1-6 different signs (add), Q7-12 same signs (subtract)
Sheet 2: twelve questions: Q1-6 scaling one term Q7-12 scaling both terms
Sheet 3: twelve questions: scaling both terms
Answer sheets provided
##Pack 2##
Same as pack 1 with different questions
Please contact Cubed Maths if you identify any limitations.
cubed.maths@gmail.com
079 497 497 81
Key words: mean, median, mode, range, statistics, frequency tables, raw scores, ordering, bar charts, dice, random.
#Midpoint worksheets:
A 1.1 No graph, no halves, positive & negative gradient
A 1.2 No graph, halves, pos & neg grad
B 1.3 Graph, first quad, no halves, pos & neg grad
B 1.4 Graph, first quad, halves, pos & neg grad
C 1.5 Graph, 4 quads, no halves, pos & neg grad
C 1.6 Graph, 4 quads, halves, pos & neg grad
Answer sheets provided
Please contact Cubed Maths if you identify any limitations.
cubed.maths@gmail.com
079 497 497 81
Key words: straight line graphs, coordinates, midpoint, positive, negative gradient, quadrants.
CCEA results.
3 years of analysis of GCSE results in Northern Ireland for all subjects:
entries
A* to A achievement
A* to B achievement
A* to C achievement
differences in female and male achievement.
Important for post-primary school and department self evaluation.
Subjects include:
35 Music
36 Physical Education
37 Physics
16 Religious Studies
17 Single Award Science
18 Spanish
19 Statistics
20 Technology and Design
CCEA results.
3 years of analysis of GCSE results in Northern Ireland for all subjects:
entries
A* to A achievement
A* to B achievement
A* to C achievement
differences in female and male achievement.
Important for post-primary school and department self evaluation.
Subjects include:
15 Engineering and Manufacturing
16 English Language
17 English Literature
18 Food and Nutrition
19 French
20 Further Mathematics
21 Gaeilge
22 Geography
23 German
24 Government and Politics
25 Health and Social Care
26 History
27 Hospitality
28 Irish
29 Journalism
30 Learning for Life and Work
31 Leisure, Travel and Tourism
32 Mathematics
33 Motor Vehicle & Road User Stds
34 Moving Image Arts
CCEA results.
3 years of analysis of GCSE results in Northern Ireland for all subjects:
entries
A* to A achievement
A* to B achievement
A* to C achievement
differences in female and male achievement.
Important for post-primary school and department self evaluation.
Subjects include:
1 Agriculture and Land Use
2 Art and Design
3 Biology
4 Bus. & Communication Systems
5 Business Studies
6 Chemistry
7 Child Development
8 Construction
9 Contemporary Crafts
10 Digital Technology Multimedia
11 Digital Technology Programming
12 Drama
13 Economics
14 All subjects
The 2023/24 performance results of all post-primary schools in Northern Ireland. The schools are divided into non-selective and Grammar schools and grouped in 5 areas: Belfast, Western, North Eastern, South Eastern and Southern.
Four GCSE performance indicators are shown for the percentage of students attaining:
a. 5 or more GCSEs at grades A* to C;
b. 5 or more GCSEs at grades A* to C including English and Maths;
c. 7 or more GCSEs at grades A* to C; and
d. 7 or more GCSEs at grades A* to C including English and Math.
Two A Level performance indicators are shown for the percentage of students attaining:
a. 3 or more A levels at grades A* to C; and
b. 2 or more A Levels at grades A* to E.
The schools include:
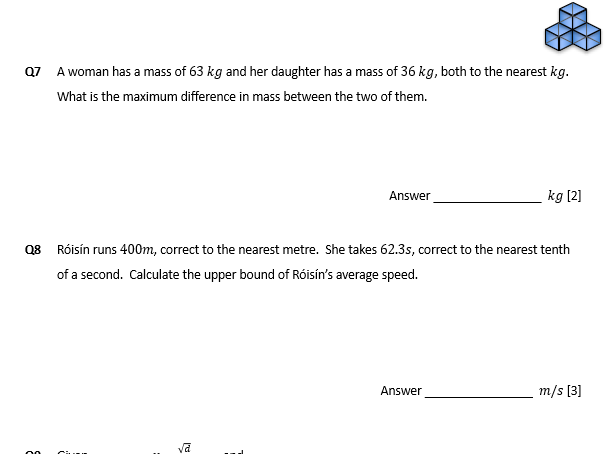
Bounds: questions for GCSE maths revision. One pdf with questions and answers.
Please contact Cubed Maths if you identify any incorrections or have ideas for further papers.
cubed.maths@gmail.com
079 497 497 81
Key words: upper bound, lower bound, longest, shortest, maximum, minimum, nearest, significant figures, decimal places, measurement.